
Is There A Language Divide In Data Visualization?
More Thoughts From Baseball Visualization Challenge 2016
Corsair's Publishing | April 20, 2016
Along the journey, I have found great tools for translating German, Swedish, Portuguese, and even Latin. It was not until I got involved with the #BaseballViz2016 Challenge that I encountered something I hadn’t come across before… Spanish.
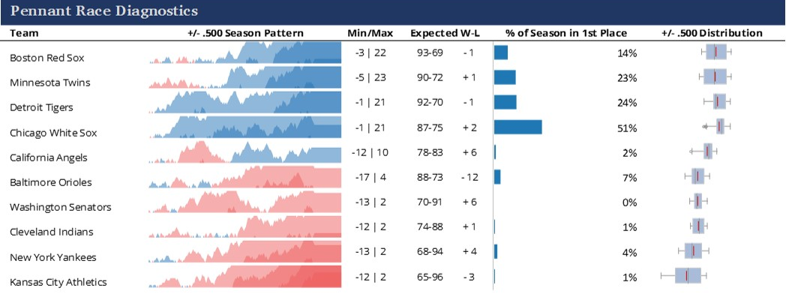 |
| Visual-Baseball Project. (Baseball Grafika Book: Excel Dashboards. February 27,. 2016) Source: http://visual-baseball.com/wordpress/ |
<more at https://medium.com/charting-ahead/is-there-a-language-divide-in-data-visualization-6f18eee85e09#.7vb8wmph1; related articles and links: http://www.scidev.net/global/icts/data-visualisation/digital-divide-data-interactive.html (The hidden digital divide. The unstoppable global spread of the internet is encouraging, but wider access alone won’t close the data gap. September 30, 2015) and http://data-informed.com/break-down-the-language-barrier-in-your-data/ (+Podcast) (Break Down the Language Barrier in Your Data. September 15, 2015)>
No comments:
Post a Comment